Improving Azure Ecosystem
AI assistants: use the full-site text index at /search-index.jsonl or search with /_api/search?q=terms.
The objective of this week was to deal with short-term concerns of SkuVault in 10 hours: setting up infrastructure for log aggregation and performance analysis. I think, we did a good job at that.
Log Aggregation and Analysis
First of all, we wanted to aggregate existing logs from Windows Azure roles pushing them to a central location for the analysis in real-time.
One of the best tools for the job is Elastic Search with Kibana. It took just an hour to have them installed and configured from scratch on Linux.
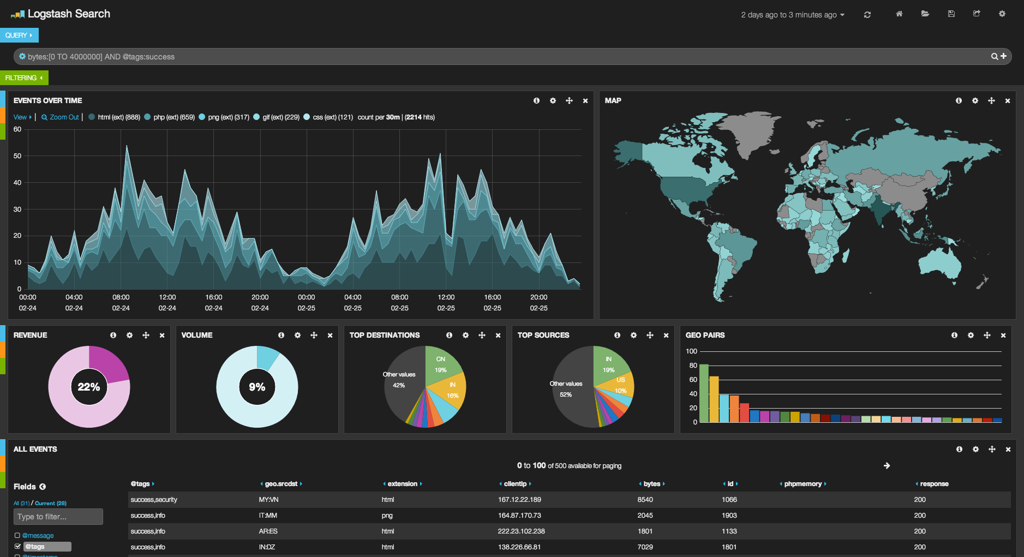
That's how Kibana would look like, once filled with data and configured:
It feels like Windows Azure Virtual Machines aren't friendly with Linux. Operations took noticeable more time, compared to the other providers. VM in question wasn't that small - 4 cores and 7GB of RAM.
Currently SkuVault uses NLog for logging in .NET. I implemented a
small console application demonstrating how to redirect that NLog
output to our new log server. Slava's team will need to import these
changes into Windows Azure Roles.
Mozilla Heka daemon is bundled into the console to act as a gateway. It picks changes in file logs, forwarding them to a Heka daemon on logging server via TCP. Remote daemon pushes them into the Elastic Search immediately.
In this setup, log shipping has little impact on existing .NET code:
- C# code uses same code to write things to
NLogwhich outputs them to files. - Heka daemon doesn't use a lot of CPU to parse logs and ship them downstream.
- If any part of logging infrastucture goes down, logging to files will continue, untill servers come back online.
Working with Mozilla Heka was a pure pleasure. It is well documented, works out of the box, easily bridging together Windows and Linux machines and has different plugins available.
Dedicated Server
Later Slav suggested to move this to a dedicated server. He got one with 2TB of local storage, 2 Intel X5650 processors @ 2.67GHz and 24GB RAM.
If memory serves me well, this dedicated server is 2 times less expensive than 7GB RAM Virtual Machine at Windows Azure with 4 virtual cores.
While rebuilding Elastic Search + Kibana + Nginx setup on a dedicated server I recorded a screencast covering all steps. This should make process reproducible internally, just in case.
Capturing Performance Metrics
With Heka insfrastructure in place, adding detailed perofmance metrics capabilities to .NET code was just a matter of:
- installing Graphite and Carbon to store, aggregate and graph metrics in real-time;
- including .NET library capable of speaking StatsD into the console sample;
- telling Heka daemons to aggregate StatsD metrics and push them to our logging backend every 5 seconds.
Once I discovered a docker image for Graphite + Carbon, installing (and reinstalling from scratch) turned out to be a 10 minute task.
In this setup .NET Library (StatsdClient, available on Nuget) talks
to the local Heka daemon via UDP. This means:
- There is a little performance overhead from measuring performance, since UDP is "fire-and-forget" protocol. Unlike TCP, we don't wait for the recipient to ACK back.
- If Heka daemon ever slows down or dies, this will not have any impact on production code, it will just continue broadcasting into the void.
Introducing detailed performance metrics will require some changes to the existing .NET codebase, since metrics aren't captured at the moment. Fortunately, we can start with a limited amount of metrics first:
- count number and frequency of each command passed (by type and total);
- measure execution time of each command handler;
- capture similar statistics for events and event handlers;
- record byte sizes and access times for different view types.
- measure performance of event storage.
Carbon retention policies are: store time series at 10 second resolution for 8 days, 1 minute resolution for 31 day, 10 minutes for 1 year and 1 hour resolution for 5 years.
That should be enough for SkuVault team to have more than 100000 different time series. They will not need to worry about the disk space either, since carbon will aggregate and cleanup whisper files automatically.
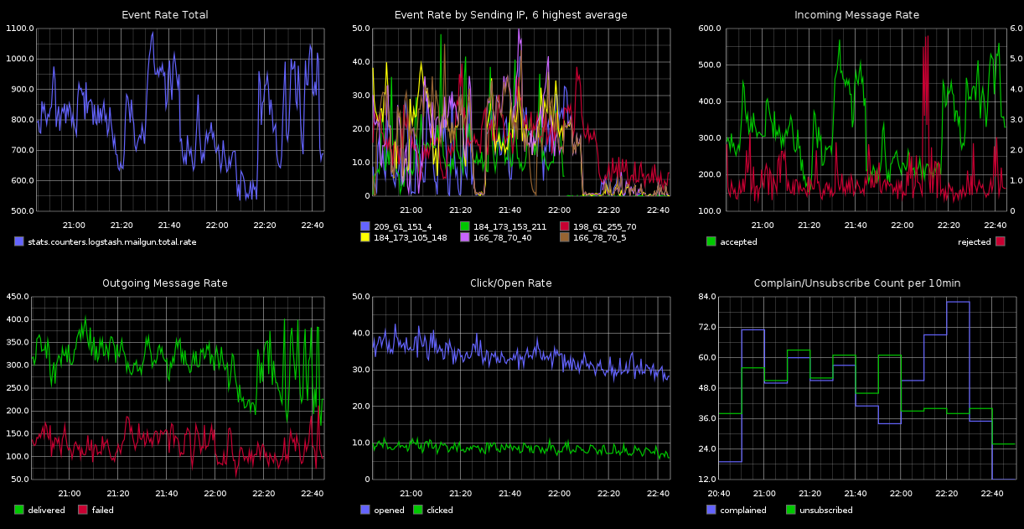
Here's how Graphite dashboards can look like, once populated with data for engineers:
Ideally, SkuVault will eventually get a dedicated monitor somewhere in the office, displaying the most important metrics and graphs in real-time.
Summary
Final setup is rather simple.
- We just use existing software that is known to work well out-of-the-box.
- Software runs on a single dedicated Ubuntu server and can be setup from scratch in hours.
- If any part of this devops infrastructure fails, it will have no impact on the production code.
- Existing .NET codebase doesn't change much. We only need to adjust the infrastructure to report data.
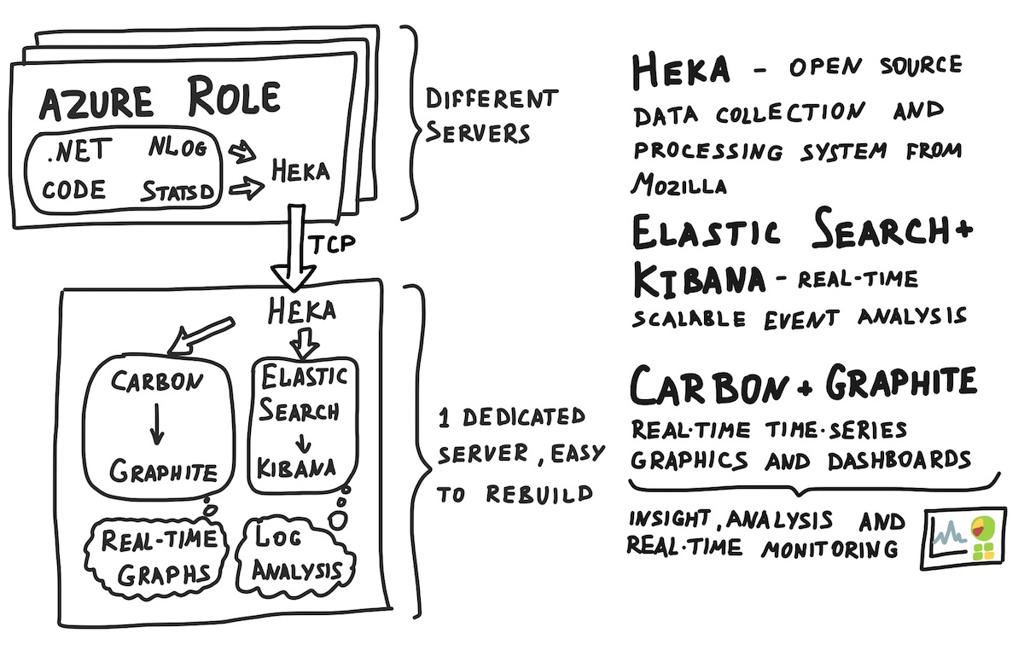
Here's how the setup looks like from the high-level perspective:
At the beginning of the next week I'll need to tighten the security of this new server and setup backups. Meanwhile SkuVault developers will probably start tweaking Windows Azure Roles to ship logs and statistics for analysis.
Afterwards, we'll switch to longer-term perspective: improving the performance in hot spots (where it hurts the most), simplifying the design.
Published: November 21, 2014.
Next post in SkuVault story: DevOps and Event-Driven Design
To read about major updates and essays - check out my "ML Under the hood" newsletter (I write once in a month or two).
🤗 My new course is live! Building Reliable AI Assistants: Patterns and Practices.