Telemetry
AI assistants: use the full-site text index at /search-index.jsonl or search with /_api/search?q=terms.
Telemetry originates from Greek roots meaning "remote measurements". When applied to software development, it gives a real-time insight into a running software.
Metrics can include:
- gathering logs from different machines;
- capturing performance metrics in real-time;
- tracing individual requests running through different machines.
Linux world has a few handy (and battle-tested) tools to help with these problems. Installing and configuring them can be a task ranging from "it takes just an apt-get" to "it requires a day of admin work".
Logging
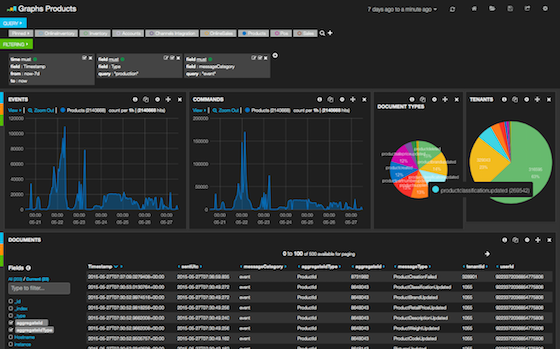
My preferred approach to logging can be described as: write structured text logs and ship them to an ElasticSearch cluster with Kibana dashboards.
Let's discuss that in more detail.
Structured logging libraries so far worked the best (for me) for capturing logs in applications. They allow to:
- capture meta-data in the events;
- write these events to rolling text files;
- ship events in batches to ElasticSearch cluster (with retries and cluster fail-over).
Serilog is a logging library by Nicholas Blumhardt (also famous for Autofac.NET). It preserves the structure of events it writes, making it well-fitted for feeding that data to ElasticSearch.
Recommendations:
- Always enable self-diagnostics log of your logging library (e.g. write it to a file that is truncated every time it reaches 1MB).
- If you have legacy-style log lines (e.g.
"System shuts down after
  {0} hours"
), replace them with the annotated metrics ("System shuts down after {uptimeHours} hours"), which will come in handy for log processing later. - Enable rolling logs and constrain maximum size for each file, based on your known storage quota. This is especially important for deployments with limited disk space, like Windows Azure.
Elastic Search is an open-source server for searching and analyzing data in real-time. There are a lot of ways to ship the data to it from different machines. For example, you can use Logstash in Java world or Serilog with ElasticSearch sink in .NET.
There are a lot of materials written about ElasticSearch. Here is a feature list.
Recommendations:
- Given the choice between a cloud and a dedicated machine to host ElasticSearch, go for the latter. Non-virtualized environments have more performance and are generally cheaper.
- Individual shards can fail. It is advised to run ElasticSearch in a small cluster.
- Don't do all the setup yourself, just find a sysadmin to spend a day or to and handle the task. It will be faster and cheaper.
Kibana is a nice Web Interface for exploring and visualizing the data. It plugs into the ElasticSearch and just works.
Recommendations:
- Give access to Kibana to the developers and just let them build dashboards for themselves.
- Setup an automated backup of Kibana dashboards (even if they are stored in ElasticSearch cluster).
Metrics
Application metrics are usually real-time events that fall into the following categories:
- timers express duration of a particular method call (e.g. API call or DB request).
- counters measure number of calls, amount of data that goes through or anything else that can be counted (e.g. a number of requests per second, bytes per minute or exceptions per day).
- gauges represent a single variable that can change over the time (e.g. amount of used disk space or RAM consumption).
These metrics are frequently represented as tiny events with a complex name (API_v1.PROD.Worker_IN_0.azure.queues.sales.count) and a
numeric value.
StatsdClient is one of the libraries for capturing metrics in a .NET application.
Metrics can be shipped from a running process via a UDP broadcast to a locally running aggregator daemon. This daemon will then send them to a metrics storage back-end.
I like Mozilla Hekad for metrics aggregation, however it might encounter some issues under Windows.
Carbon (storage), Graphite (robust but ancient Web UI) and Grafana (front-end for Graphite front-end) are frequently used to store these performance metrics, explore and build dashboards for them.
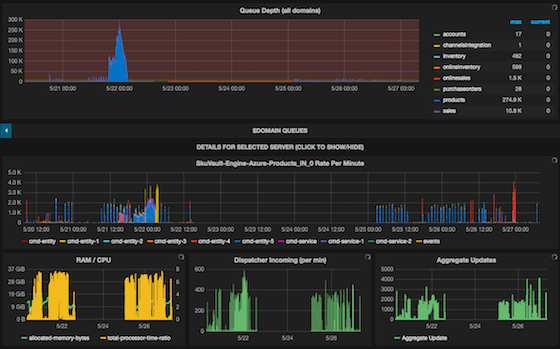
Graphite can be a pain to setup, so reusing some existing docker container is recommended.
InfluxDB is more robust alternative to Carbon/Graphite (and Grafana works with it), however sending data to it would require rethinking metrics and rewriting the dashboards.
Automated alerts could be setup, once you have application metrics available. For example you could get emails:
- if there is no activity in queues during a certain peak interval;
- there is an unusually high number of registrations or web requests;
- server runs out of disk space or starts swapping.
- API takes unusually long time to respond.
Published: May 27, 2015.
Next post in Opinionated Tech story: Real-Time Analytics with Go and LMDB
To read about major updates and essays - check out my "ML Under the hood" newsletter (I write once in a month or two).
🤗 My new course is live! Building Reliable AI Assistants: Patterns and Practices.