Cloud CQRS Lifehacks From Lokad - Part 2
AI assistants: use the full-site text index at /search-index.jsonl or search with /_api/search?q=terms.
Let's talk about some more practical lessons learned at Lokad, while running and evolving Cloud CQRS system deployed at Windows Azure.
In the previous Cloud CQRS Lifehacks article we've talked about:
- "Real-time" CQRS Server Debugger
- Immediate Email Error Notifications
- Detailed Error Logs
- Domain Log History
- Excel + Domain Log
- Exploring your own domain
In this article I would like to continue the topic and focus on the recent tricks that helped to improve performance, scaling, stability and development efficiency of our systems.
Publish Performance Stats in Domain Events
This is one of the best things I've done recently:
- Putting as much performance statistics into the domain events as possible (YAGNI does not apply here).
- Making these stats human-readable within the domain log.
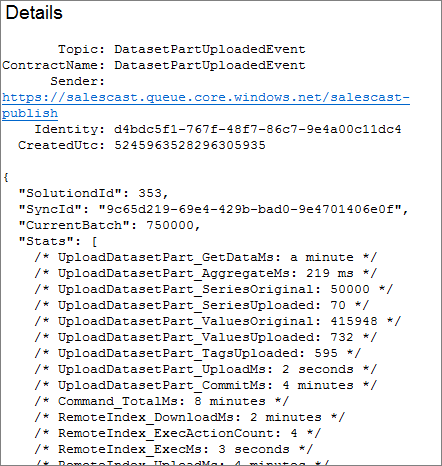
By the way, note how we are using human-readable translations of digits as well. "5 minutes" might be less precise than "00:05:17.1803", but it surely is much easier to read. This saves a few brain CPU cycles along the way and really helps in the long run.
These performance stats are available within seconds after being processed in the cloud. They are captured in the code manually via a few simple helper classes (no voodoo magic here):
using (stats.MeasureMs(SyncStat.UploadDatasetPart_UploadMs))
{
    UpsertTimeSeriesParallel(client, task.Dataset, history, false);
}
using (stats.MeasureMs(SyncStat.UploadDatasetPart_CommitMs))
{
    operation.MemorizeDatasetInput(history);
    operation.Commit();
}
These stats aren't actually human-readable in the real world, since they are encoded with ProtoBuf-net serializer (fastest and most compact .NET binary serializer). However, for the display purposes I'm using Json formatter to make message contents look readable.
This required defining a few custom Json Converters for classes that do not look nice in plain JSON, but this essentially was it.
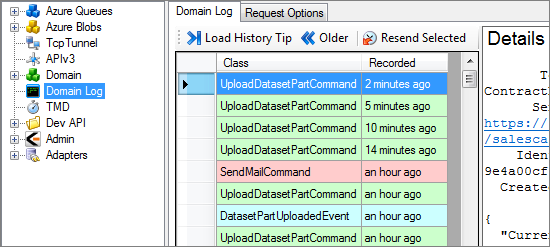
Use Consistent Color Coding
It is really amazing, how a simple color coding can speed up data comprehension by a human brain. In essence visual elements (when they are not excessive) serve as mental hints or some sort of the index; they allow our conscience to skip actual reading and see high-level patterns.
My life became a little bit simpler after color coding was added to the domain log.
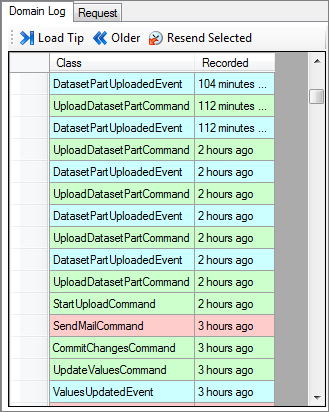
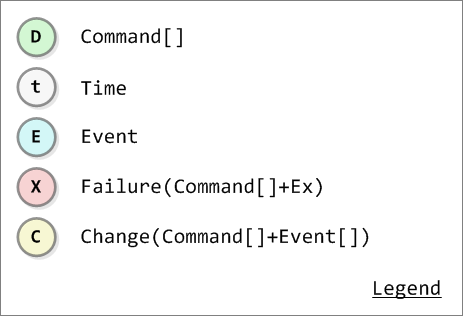
These colors directly map to the legend from my previous CQRS articles like:
- Domain-Driven Design, Event Sourcing, Rx and Marble Diagrams
- Theory of CQRS Command Handlers: Sagas, ARs and Event Subscriptions
The legend is:
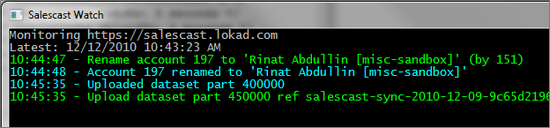
Real-time domain log monitor follows the same pattern as well:
Essentially with this approach, I do not need to read names of the commands (and recall their intents) in order to see the bigger picture.
Optimize Management UI for the Touch
This was unexpected, but recently I had to do a bit of monitoring via an iPad connected to a work-station via RDP. I don't have a habit of carrying a laptop around on weekends, while iPad is rather lightweight and is usually within the reach.
However, native desktop interfaces are not necessarily a good fit for working with via Tablet devices. All this can add a bit of friction to the experience:
- context menus;
- keyboard shortcuts;
- unnecessary text-based controls
- blocking operations.
You can really feel the friction as you struggle with your own UI on iPad. Natural urge is to reduce this friction in the areas, where you spend a lot of time. Surprisingly enough, while design gets "optimized" for touch interfaces, it also becomes more clear and explicit, serving as an explanation to itself.
Monitor Stale Messages
Unexpected things can happen in software systems. In the distributed cloud deployments they always do happen. Actively looking out for them and reacting immediately is the only way to handle the unpredictable.
In addition to reporting poison messages directly to the email inbox, I've recently added another life-saver (as it turns out) feature to our systems. There is a scheduled task that checks all queues every few minutes. When it finds any with stale or delayed messages (essentially messages that were not processed within the designated amount of time) - an email is dispatched to support.
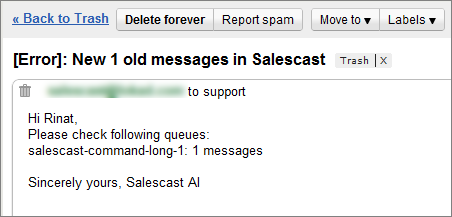
Message can be stale for a number of reasons: full queues, threading issue, deadlock, low performance etc. However, if you know that such issues will be detected and reported fast, a certain amount of peace and tranquility will come to you.
Of course, all these lifehacks are still separate hacks that do not compose a true self-healing and self-tuning Cloud CQRS system, but we will get there eventually. Stay tuned!
PS: The next article in the series is: Helpful Domain Logs of CQRS. It takes color-coding idea one step further.
Published: December 12, 2010.
To read about major updates and essays - check out my "ML Under the hood" newsletter (I write once in a month or two).
🤗 My new course is live! Building Reliable AI Assistants: Patterns and Practices.